 .
.I wrote a couple of (hopefully) useful quick and dirty scripts to quickly see which domain is eating your precious CPU cycles :
- xenupdate.py: should be run in crontab ; will start xm list, parse its output, create on demand RRD files for your domains, and update them.
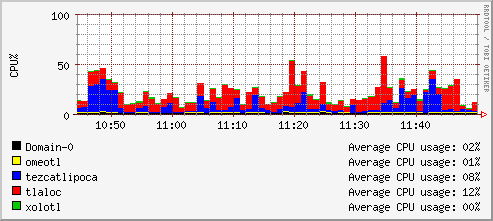
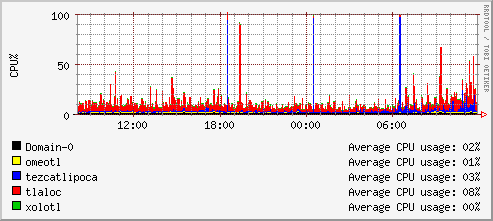
- xengraph.py: should be run in crontab or manually ; will draw nice cumumlative graphs named xen-period.png in current directory, based over the previous RRDs. period will be hourly (display activity over the last hour), daily (over the last day), weekly, monthly, and yearly.
How to use them :
- install the required packages (rrdtool and python ; I don't use any fancy python feature so no extra package should be needed)
- you might have to modify xenupdate.py (path to #xm# binary is hardcoded)
- put * * * * * /path/to/xenupdate.py /path/to/rrds/ in your crontab (RRD files will be created in the given directory)
- if you want to run the update script less frequently, use */5 * * * * instead (to run it every five minutes) ; if you want to run them less often than every 10 minutes, you have to modify the 666 value in the xenupdate.py script (it's the "heart-beat" value of the data source ; if it gets updated less than 666 seconds, it will be considered invalid)
- run (from crontab or manually) xengraph.py /path/to/rrds/ ; you can modify it if you want to change the output file, the timescale, the colors ...
Don't forget the trailing slash ; if the argument is /path/to/rrds then the update script will create files named /path/to/rrdsDomain-0 and the graph script will create files named /path/to/rrdsxen-hourly.png etc.
What happens when xenupdate.py runs :
- first, it does a xm list and parses its output, getting the name and CPU time of each domain
- then, for each domain, it checks if a RRD file exists, and creates it if needed
- after ensuring that the RRD file exists, it updates it (NB: the value stored in the RRD is the CPU time in milliseconds, not seconds ; because COUNTER data sources must be integer values)
- if a domain is dead, the RRD file won't be updated, and nothing else will happen
Feel free to adapt those scripts to your needs, they are (of course) GPL.
Thanks to the people who made Xen such an exciting project ! (Ian, I promise I will attach this serial cable and try to debug those restore/save problems real soon now!)
TODO: tweak the RPN expressions to get UNKNOWN values when computing AVERAGE, but ZERO values when drawing the STACK (else we will get a flat graph as soon as one domain is shut down but is RRD isn't removed).
Comment:
In Xen 3.0 you have to edit the xenupdate.py script.
Change the line:
name,id,mem,cpu,state,cputime,console=re.split("[\t ]+",domain)
to
name,id,mem,cpu,state,cputime=re.split("[\t ]+",domain)
Thanks for the good work :)
Phillip Hagedorn - hagedorn[a]media-net.de
Comment:
On debian testing, with rrdtool 1.2, the -unit % command line argument doesn't work.
I have to remove it.
Thanks for these nice scripts.
Eric Veiras Galisson - http://www.veiras.info